See the heartbeat of your network.
PingGrapher charts round-trip latency to any host in real time — with live latency zones, packet-loss and jitter tracking, and a menu-bar pulse that's always one glance away.
Requires macOS 13 Ventura or later · Universal — Apple silicon & Intel
Everything in one window
A focused tool for one job, done right.
No dashboards to configure, no agents to install. Point it at a host and watch the latency unfold.
Real-time latency graph
Every reply plotted the instant it lands — smooth, continuous charting down to sub-millisecond resolution.
Latency zones
Color-banded thresholds — healthy, elevated, critical — make trouble obvious before anyone files a ticket.
Menu-bar pulse
Live round-trip time right in your menu bar. Click for a sparkline and recent history without opening the app.
Packet loss & jitter
Track drops and variance alongside latency — spot the instability a single ping number always hides.
Multi-host monitoring
Watch your gateway, DNS, and remote servers side by side. Add as many hosts as you need to keep an eye on.
Private by design
Every ping runs locally on your Mac. No account, no telemetry — nothing about your network ever leaves the machine.
Real-time graphing
Latency, drawn the moment it happens.
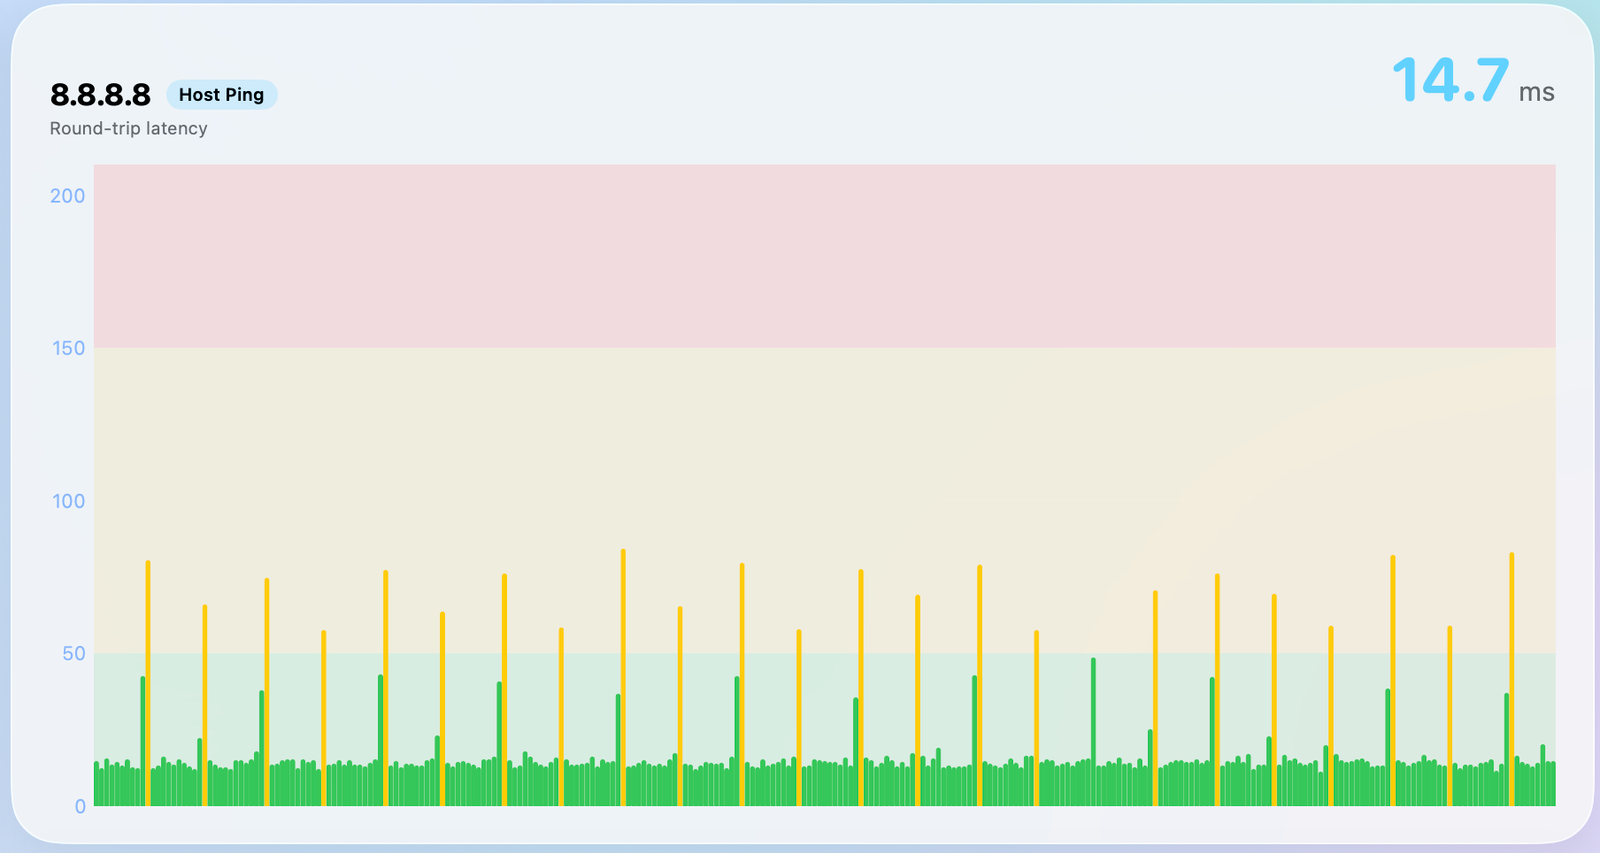
PingGrapher streams every ICMP reply onto a live, scrolling chart. Steady green bars are your baseline; the orange spikes are the outliers you actually care about — instantly visible, never buried in an average.
- ✓Continuous high-frequency sampling with a smooth scrolling timeline
- ✓The big current reading stays pinned, so the latest RTT is always front and center
- ✓Hover any point for the exact timestamp, RTT, and sequence number
Latency zones
Good, elevated, critical — at a glance.
Set your own thresholds. PingGrapher paints the background in living color so the state of a connection reads from across the room.
Always on
Your network's pulse, in the menu bar.
PingGrapher lives quietly in your menu bar with the current round-trip time always showing. Click it for a sparkline of the last few minutes and jump to the full window only when something looks off.
- ✓Live RTT in the menu bar, tinted by zone
- ✓A Liquid Glass dropdown with recent history at a glance
- ✓Optional alerts when a host goes dark or latency spikes
 14.7 ms9:41
FAQ
Questions, answered.
What exactly does PingGrapher do?
What are the system requirements?
Can I monitor more than one host?
Is my network data private?
Can I customize the latency thresholds?
Does it keep history?
Ready to feel your network's pulse?
Download PingGrapher and put a live heartbeat monitor for your connection right in your menu bar.